What’s the yield curve? Why is it important? What does it mean?
The US Treasury yields inverted; it was all over the news, but why? A yield curve represents yields of fixed-income instruments across various maturities. It plots the yield on issued treasury securities.
Treasury securities are bonds or Treasury Bills issued by the government to raise funds. The government can borrow for 91 days by issuing securities called Treasury Bills. The government can also borrow for more than 12 months by issuing Bonds securities. Securities like bonds pay a coupon, representing the fee or compensation earned by the lender of cash to the Government.
The yield is the return earned from owning that security; the coupon paid is divided by the security price. Thus, a two-year FG Bond that costs N100 and pays a 5% coupon will yield 0.5% (5/100).
A yield curve like diagram 1 below will plot the duration of the issued security on the X-axis. Thus, we see the tenors from zero to twenty years. The Y-Axis measured the percentage yield from 2% to 14%.
Diagram 1: The Nigerian Yield Curve March 2022

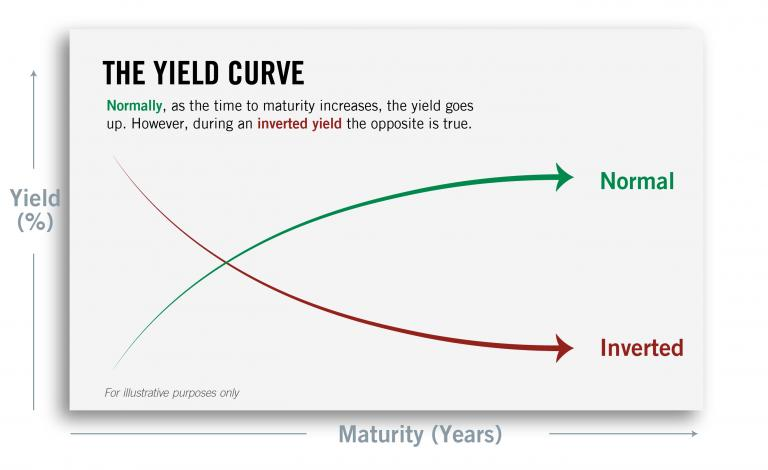
The yield curve maps the relationship between duration and yields earned. The general rule is simple; the unforeseen volatility if you lend money out for one year, is less than the unseen volatility of five years. This means that you, the lender, should demand a higher rate of interest from the borrower, in this case, a higher coupon payment.
A normal yield curve will thus have an upward slopping curve look to it. See figure 2. Indicating that the yield on a two-year bond is less than the Interest rates paid on a five-year bond yield. In an economy, if borrowers are optimistic about their economic prospects, they will borrow to invest in capital projects and expand their operations.
This demand for longer-term funds to invest leads to higher interest rates demanded by the lenders; thus, the curve steepens as rates rise on longer-dated instruments.

However, the reverse occurs when investors have doubts about the economic future. Perhaps a covid 19 infection will paralyze trade and commerce, leading to businesses scaling back investments and spending.
This fall in spending translates to less demand for credit to expand operations; this fall in demand for credit will cause interest rates to fall especially longer-term interest rates. Thus, the graph will gradually become flat, meaning short-term rates are at par with long-term rates.
A flat curve is also an inflexion point. Economic activity can pick up, and rates begin to rise again, steeping the yield curve again, or economic activity falls.
From a flat rate position, if the outlook for economic activity becomes more pessimistic, the investors will completely abandon borrowing money to invest. This expectation of a decline in longer-term interests is thus reflected in the longer-term bond yield, like the ten years being lower than the shorter-term 2-year bond yield.
An inverted is thus abnormal and signals to the market that economic activity will decline. Remember, correlation is not causation, The yield curve itself does not cause a recession but in the US, an inverted curve has preceded the last eight recessions since 1969 and the yield curve has inverted before each recession in the past fifty years.
If we take the US today as an example, the yield on the 10-year benchmark note fell below that of the two-year note on Tuesday the 29th of 2022; this is in an environment where the Federal Reserve is raising rates in the economy, but the US economy still looking for workers to fill open slots estimated at 5m above the number of workers in America seeking jobs. High jobs and recessions do not mix. Still, an inversion indicates weaker growth ahead.
If there is no correlation between yield curves and recession, why is it an important event to note? An inversion is an early warning indicator that the economy sees trouble ahead. It also means companies will see shorter-term borrowing costs for working capital rise as shorter-term rates go up. These added costs cramp consumption and, ultimately, economic activity, which is never good. Also, intermediary lenders that borrow and lend out will see their margins squeezed.
For borrowers, the cost of credit on credit cards and auto loans will rise. it’s good to advise to pay down open lines of credit, especially shorter lines, and check to ensure all Adjustable-Rate instruments can be refinanced, meaning you take a new loan to pay off into a longer fixed term.
What to Invest During An Inversion?
During a yield curve invasion, the keyword is quality and duration. Since risky long-dated assets will pay the same or lower yield than less risky assets, they seek to invest in short-term, high-grade securities like Treasury Inflation-Protected Securities (TIPS). TIPS traditionally offer a lower return for less volatility, but they become a preferred destination because the risk premium is absent in an inverted curve environment.
Avoid long-dated securities and growth stocks that finance their expansion by high gearing, meaning excessive borrowing.